January 2017 market update
A look back at 2016 condo sales in Panama City Beach
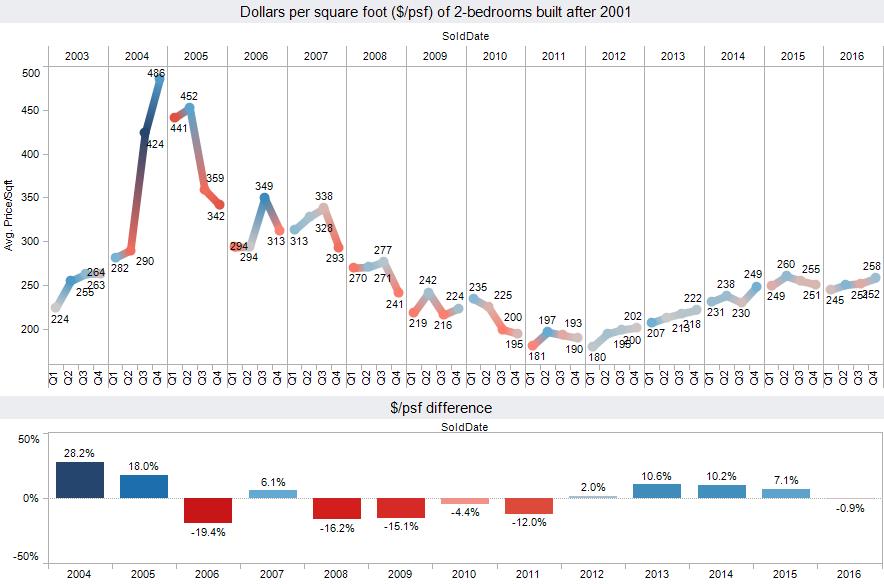
The 2016 Panama City Beach condo market was a bit of a mixed bag. The average sales price per square foot for condos built in the area after 2001 are down less than 1% from last year. This year saw some floor plans increase in price while others were flat or fell lower. There is still a healthy demand for condos as the area continues to improve and mature. Strict financing requirements are providing a healthy market free from speculators and flippers.
Condo Sales
Condo sales volume
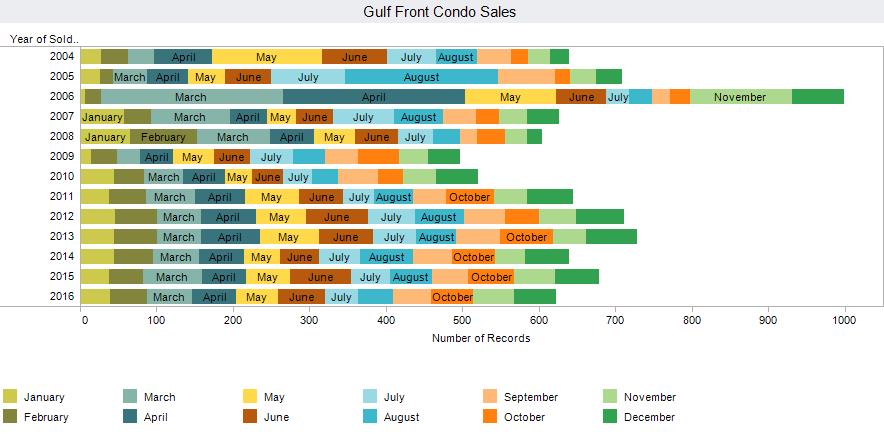
The Panama City Beach condo sales volumes are also down 8.3% year over year. It is helpful to understand that many owners paid prices 20-30% higher than what condos are selling for today. They were financially capable enough to weather the financial crisis. As prices increased for the fourth consecutive year in 2015, the Panama Beach City area reached a point where fewer buyers were willing to pay the higher asking prices. The time of large volume distressed sales is over. Out the 622 condos that sold this year, only 12 were foreclosures. I believe we can expect to see these lighter sales volumes continue. The 622 condo sales this year demonstrate a balance between supply and demand.
Individual Condominiums
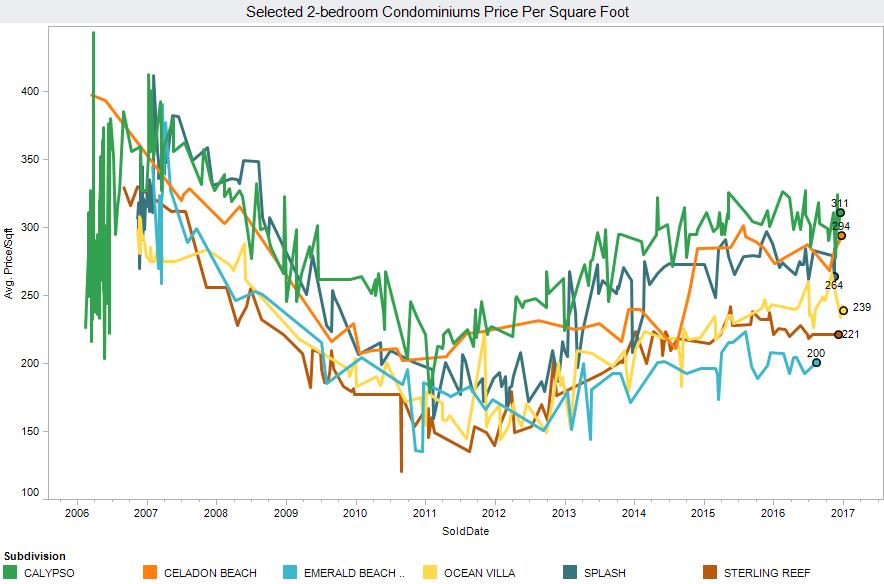
Measuring the entire Panama City Beach condo sales market in one graph does not tell the entire story. Some condos have seen nice increases this year, while others have been flat or fallen back in pricing. It is also helpful to see that different condominium buildings command different prices. Here is a graph featuring different condos in Panama City Beach to show historical and current price differences. For example, Calypso is currently selling within the range of $278 to $324 per square foot, while a recent sale at Emerald Beach Resort sold for only $200 a square foot.
Ocean Villa is up 3.5% in 2016
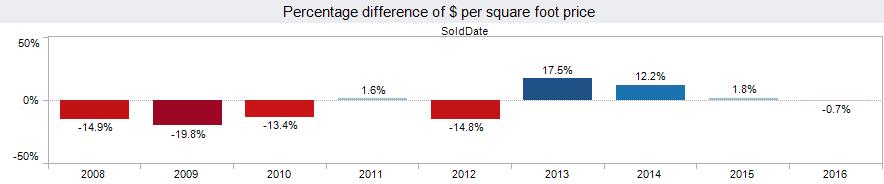
Calypso is up 0.1%
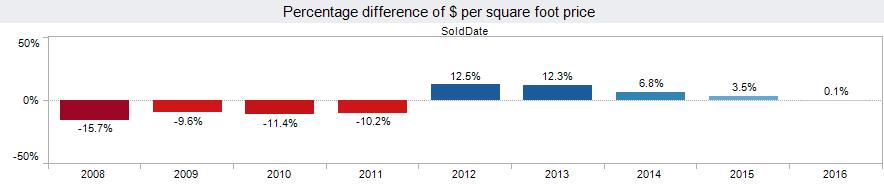
Emerald Beach is down 0.7%
Splash is down 1.7%
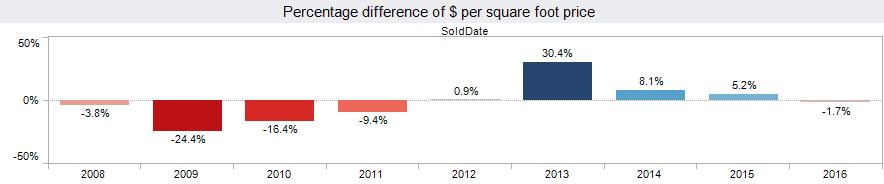
Sterling Reef is down 3.3%
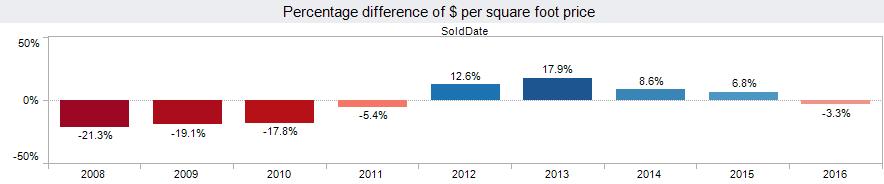
Celadon is down 3.5%

With the exception of Ocean Villa and Celadon, all of the condos shown here have sold in the same price range for 3 years now.
Condos with highest percentage increase during 2016

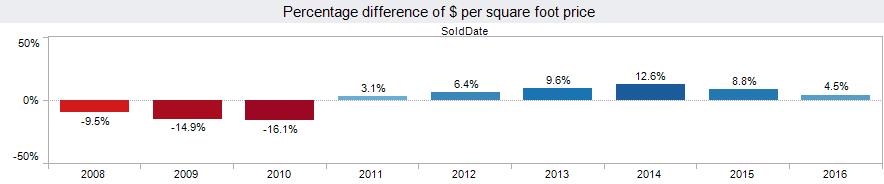
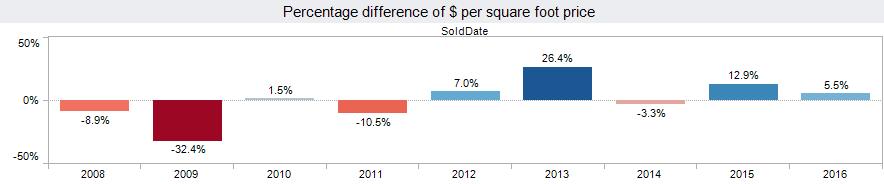
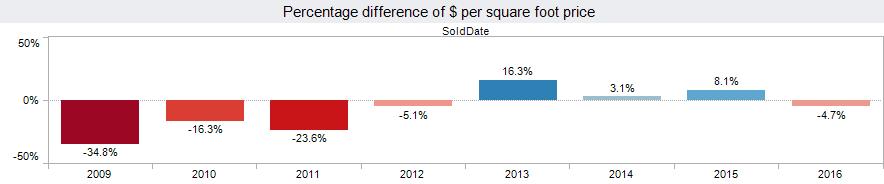
Edgewater, Emerald Isle, and Long Beach condominium saw the largest average percentage price increases in 2016.
Edgewater

Edgewater is one of the older condominiums in Panama City Beach. While many of the older condominium prices have lagged behind newer buildings in the recovery, these condos should not be overlooked. Edgewater has some of the best resort amenities in Panama City Beach.
Emerald Isle
Emerald Isle is a condo with functional floor plans and amenities. Several condominiums on west side of Panama City Beach are seeing price increases due to their location.
Long Beach
Long Beach condominium has some of the best floor plans in Panama City Beach. It is often overlooked due to its association due prices. These prices are due to a loan the association is currently paying off. When that occurs, association dues are likely to come in line with other condos in the area. Here is an article that covers the Long Beach association dues in depth.
Condos with highest percentage decrease during 2016

Grand Panama Beach Resort
Grand Panama gave back more than half of its price gains from 2015 this past year.
Treasure Island
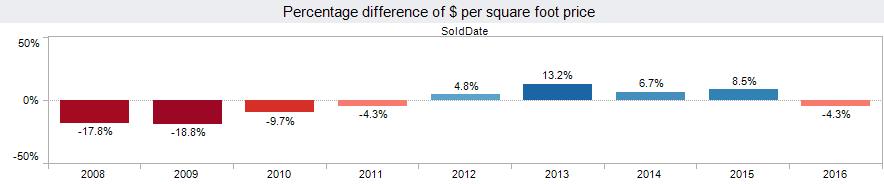
Treasure Island also gave back a good portion of the gains we saw in 2015.
The mentality behind this market
The Panama City Beach condo market shows every sign of being a healthy market. You are not seeing any flipping of condos, and you are not seeing speculators. There are strict guidelines for those qualifying for credit. This provides a balanced market that we are likely to continue seeing for some time.
Panama City Beach real estate, Panama City Beach condos for sale, Real Estate Market Updates
- Created on .
- Last updated on .
- Hits: 10374